
Tazin M
New SellerTazin Mahanus
Data Analyst | MS Excel | Power BI | DAX | VBA | Macros
About
Hi there, I’m Tazin Mahanus, a professional Data Analyst with over 3 years of experience in MS Excel, Power BI, data analysis, reporting, and automation. I specialize in transforming raw data into meaningful insights through interactive dashboards, automated reports, and data-driven solutions that help businesses make smarter decisions. As a Data Analyst, I work extensively with MS Excel and Power BI to analyze, visualize, and present data in a clear and impactful way. I create dynamic Power BI dashboards, build data models, write DAX measures, and connect multiple data sources to deliver accurate and real-time business insights. In Excel, I develop advanced dashboards, formulas, VBA automation, and macros to streamline workflows and improve productivity. Whether you need Power BI dashboards, Excel-based reporting, or automated data analysis solutions, I ensure accurate, reliable, and efficient results. My expertise as a Data Analyst allows me to clean, validate, analyze, and visualize data effectively—helping organizations track performance, identify trends, and improve decision-making. Skills: ☛ Data Analyst: Data cleaning, validation, analysis, visualization, and reporting ☛ Power BI: Interactive dashboards, data modeling, DAX, Power Query, and data visualization ☛ DAX: Measures, calculated columns, time intelligence, and performance optimization ☛ MS Excel: Advanced formulas, functions, pivot tables, and data analysis ☛ Excel VBA: Custom macros, automation, and workflow optimization ☛ Excel Macros: Automate repetitive tasks and improve efficiency ☛ Excel Dashboards: Dynamic, interactive, and business-focused reporting ☛ Data integration from multiple sources for automated reporting and insights Why Hire Me: ☛ A skilled Data Analyst with strong expertise in Power BI, MS Excel, Excel VBA, and dashboards ☛ Proven experience delivering accurate, insightful, and business-ready reports ☛ Focused on automation, efficiency, and data accuracy ☛ Strong ability to turn raw data into actionable insights ☛ Committed to understanding business needs and delivering customized, scalable solutions ☛ Reliable, detail-oriented, and always focused on timely delivery If you’re looking for a professional Data Analyst, Power BI specialist, or Excel automation expert to build insightful dashboards and automated reporting solutions, I’m here to help. Let’s turn your data into a powerful business asset 🚀
Seller Stats
Completed Orders
0
Completion Rate
0%
On-Time Delivery
0%
Member Since
April 2026
Education & Certifications
B.B.A
National University, 2023
MS Excel
Codemanbd, 2023
Power BI
Tanvir Academy, 2023
Portfolio
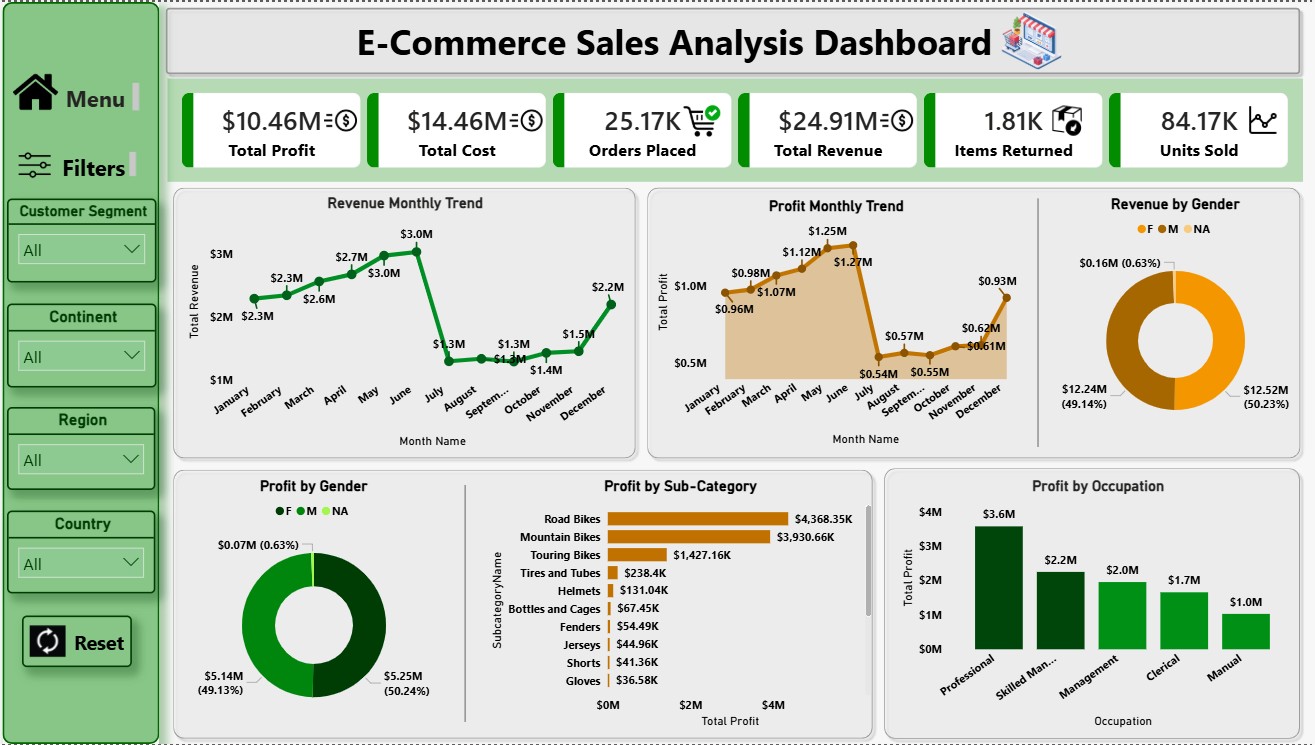
Power BI - E-Commerce Sales Analysis Dashboard
Designed an interactive e-commerce sales dashboard to track revenue, orders, profit, and customer behavior. The dashboard provides insights into sales trends, top-performing products, categories, regions, and customer segments. Implemented KPIs, time-based analysis, and drill-downs to support data-driven decisions, optimize performance, and identify growth opportunities through clear and actionable visualizations.
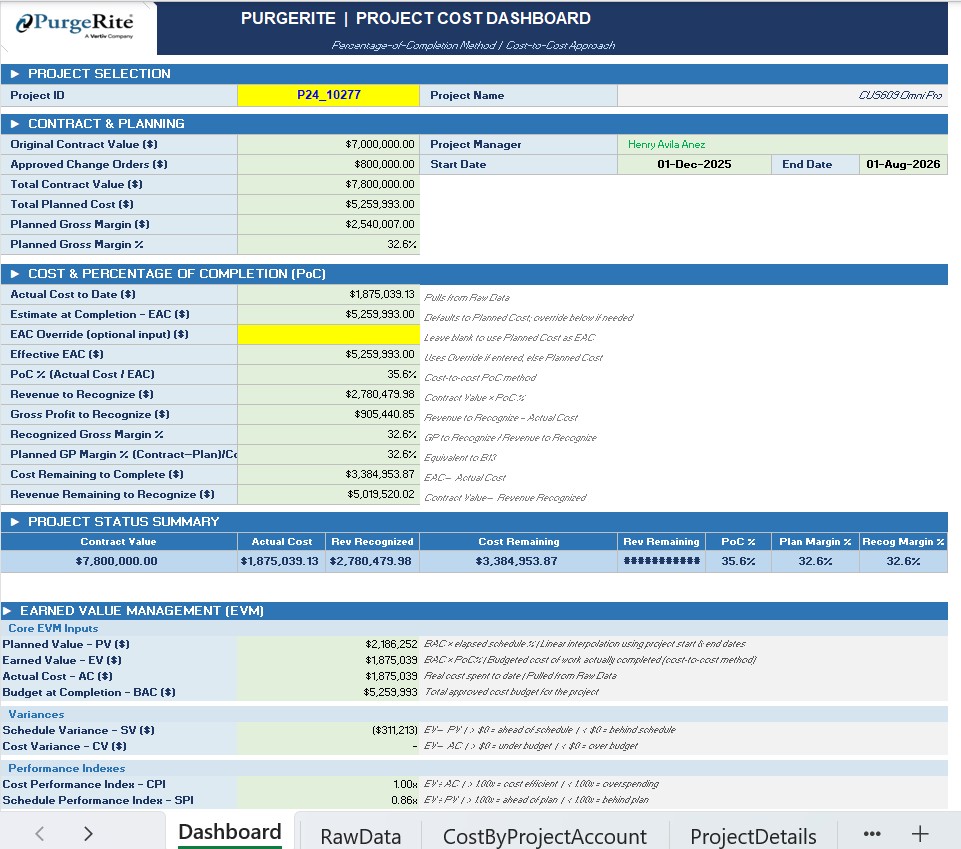
Project Cost Dashboard
The dashboard allowed project managers to monitor key metrics such as Actual Cost by different accounts, Planned Cost, Profit Margin, and Gross Margin in a single, organized interface. Using Excel formulas, data modeling, and pivot tables, I structured the data so that users could quickly analyze project performance and access important financial insights with just one click. The goal was to simplify complex data, improve visibility into project costs, and save time by consolidating multiple calculations and reports into one efficient dashboard.

Power BI - Uber Data Analysis
In this project, I analyzed Uber trip data using Power BI to uncover key insights into ride patterns, demand trends, and operational performance. The objective was to transform raw trip-level data into an interactive dashboard that supports data-driven decision-making. The dashboard highlights total trips, trip distance, revenue trends, peak hours, and location-based demand analysis. Advanced DAX measures and Power Query were used for data cleaning, transformation, and accurate metric calculations.
 1/2
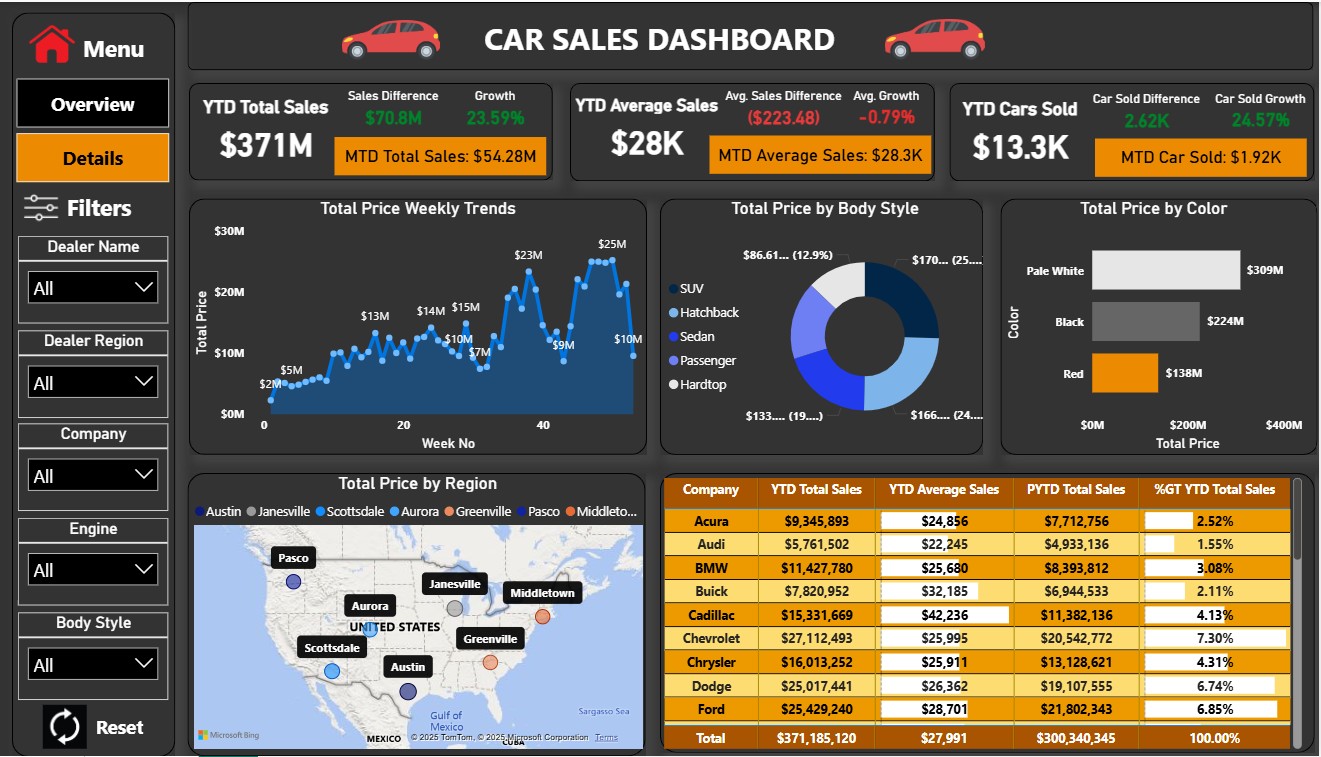
1/2 Power BI - Car Sales Dashboard
This Power BI Car Sales Dashboard provides a clear overview of sales performance, revenue, profit, and trends. It features interactive visuals to analyze sales by vehicle model, region, and time period. Built using optimized data modeling, DAX measures, and Power Query, the dashboard enables quick insights, performance tracking, and data-driven decision-making for sales teams and management.
 1/3
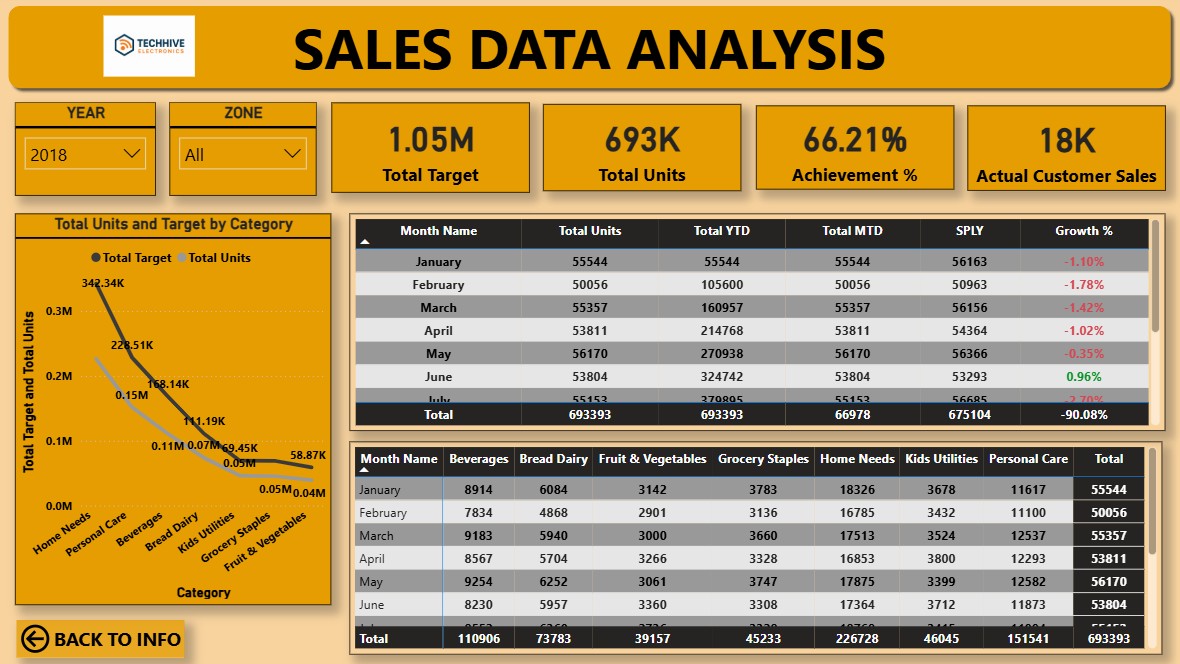
1/3 Power BI - Sales Data Analysis
This Power BI dashboard analyzes sales data to provide clear, actionable insights into revenue, profit, and performance trends. It includes interactive KPIs, time-based analysis, and filters by region, product, and customer segment. Using optimized data modeling and DAX, the dashboard helps identify top products, sales trends, and growth opportunities, enabling data-driven business decisions.
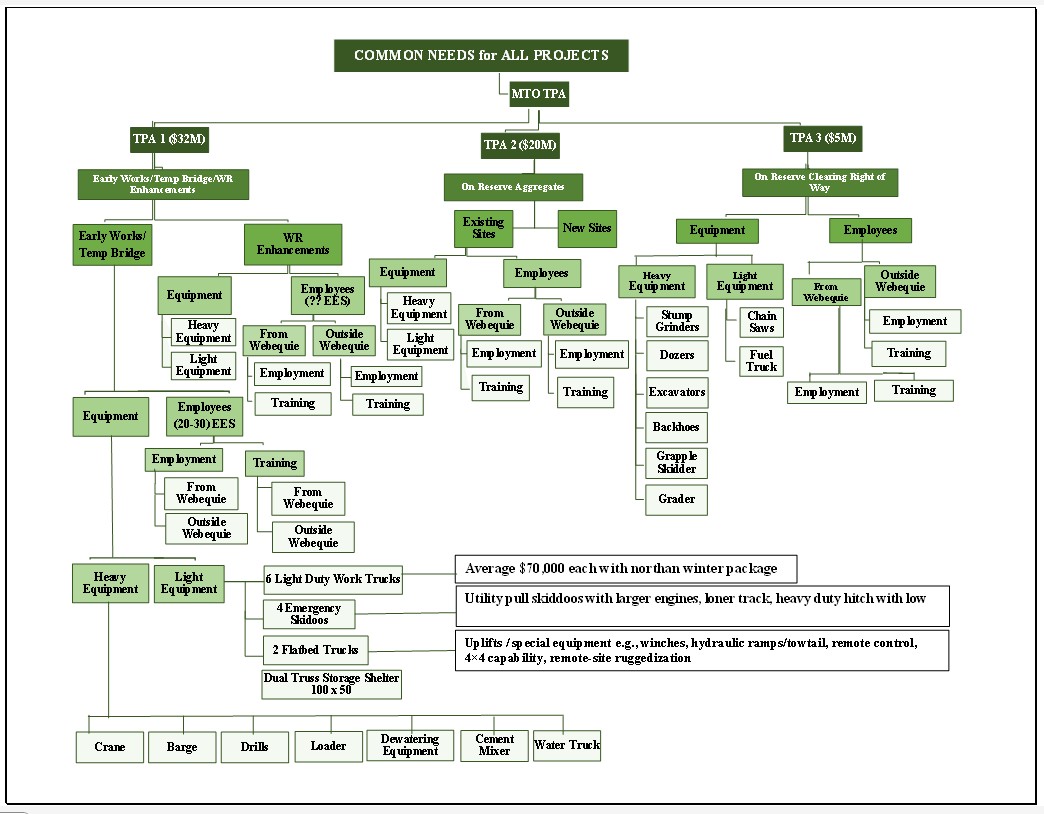
Flow Chart making in Excel from Mind Map
Create a flowchart in Excel from a mind map by converting ideas into a clear step-by-step process. Start by outlining main concepts from the mind map, then use Excel’s SmartArt (Process or Hierarchy layouts) or Shapes to represent each step. Connect them with arrows to show relationships or sequence. This helps visualize workflows, decisions, and dependencies directly in Excel for easy editing and presentation.
 1/4
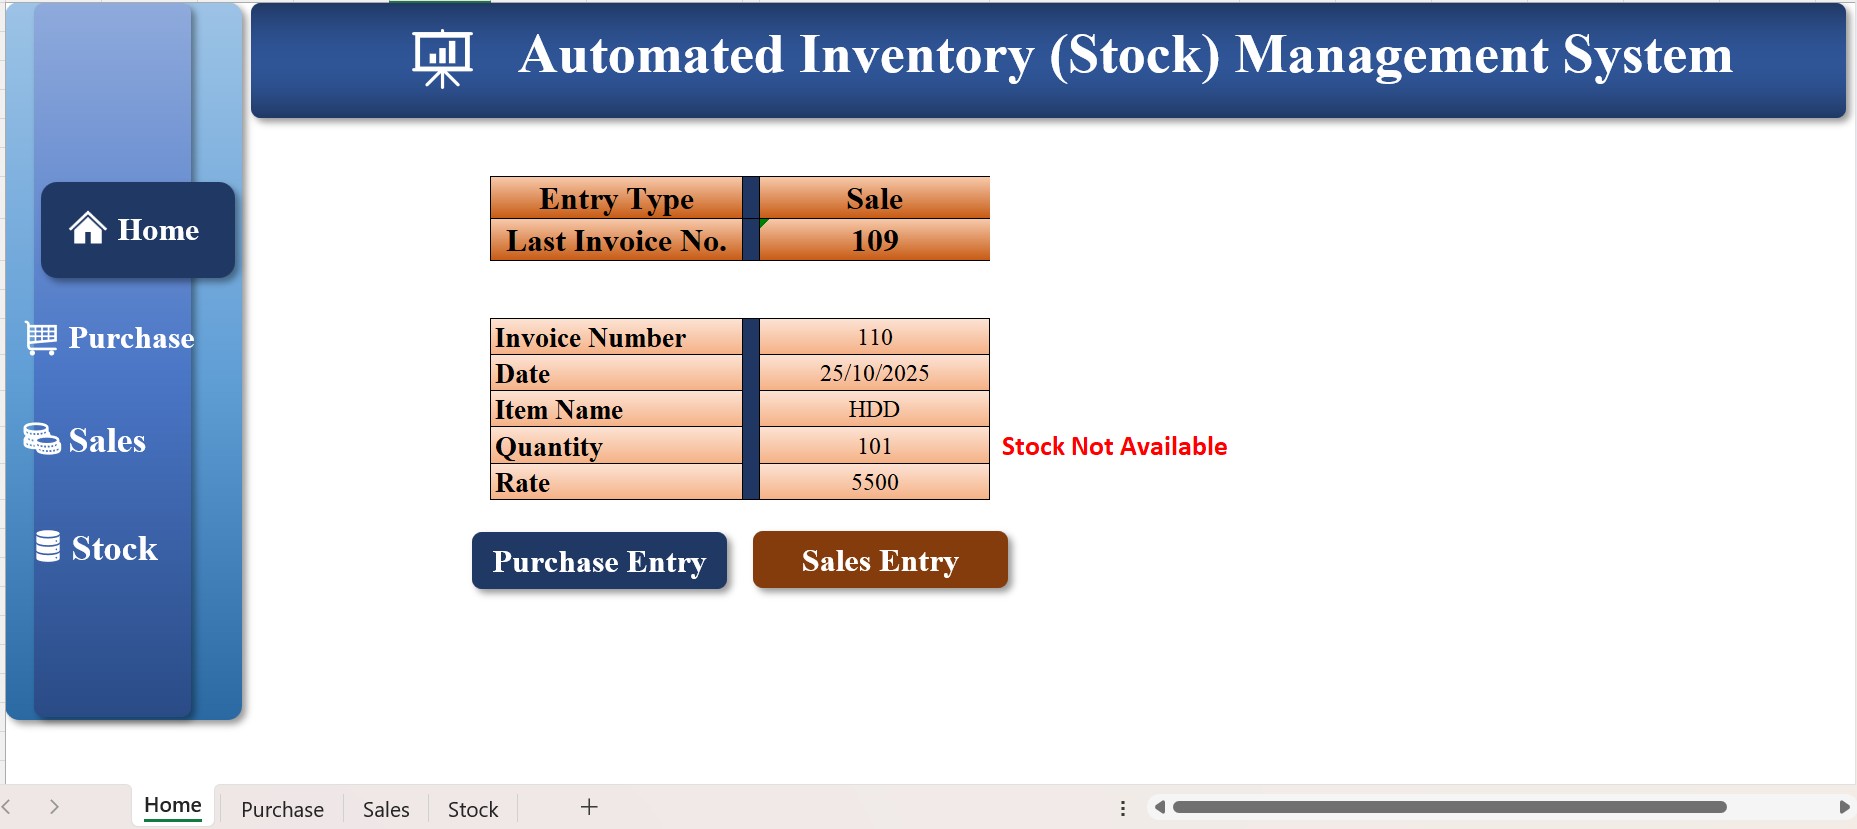
1/4 Automated Inventory Management System in Excel
This Automated Inventory Management System in Microsoft Excel helps businesses efficiently track stock, sales, and purchases in one place. It features automatic stock updates, low-stock alerts, and real-time dashboards for quick insights. With built-in buttons, dropdowns, and data entry forms, it simplifies daily inventory tasks while reducing manual errors. The system also includes monthly and yearly reports, giving a clear view of product performance and stock value — a perfect solution for organized, time-saving inventory management.
 1/6
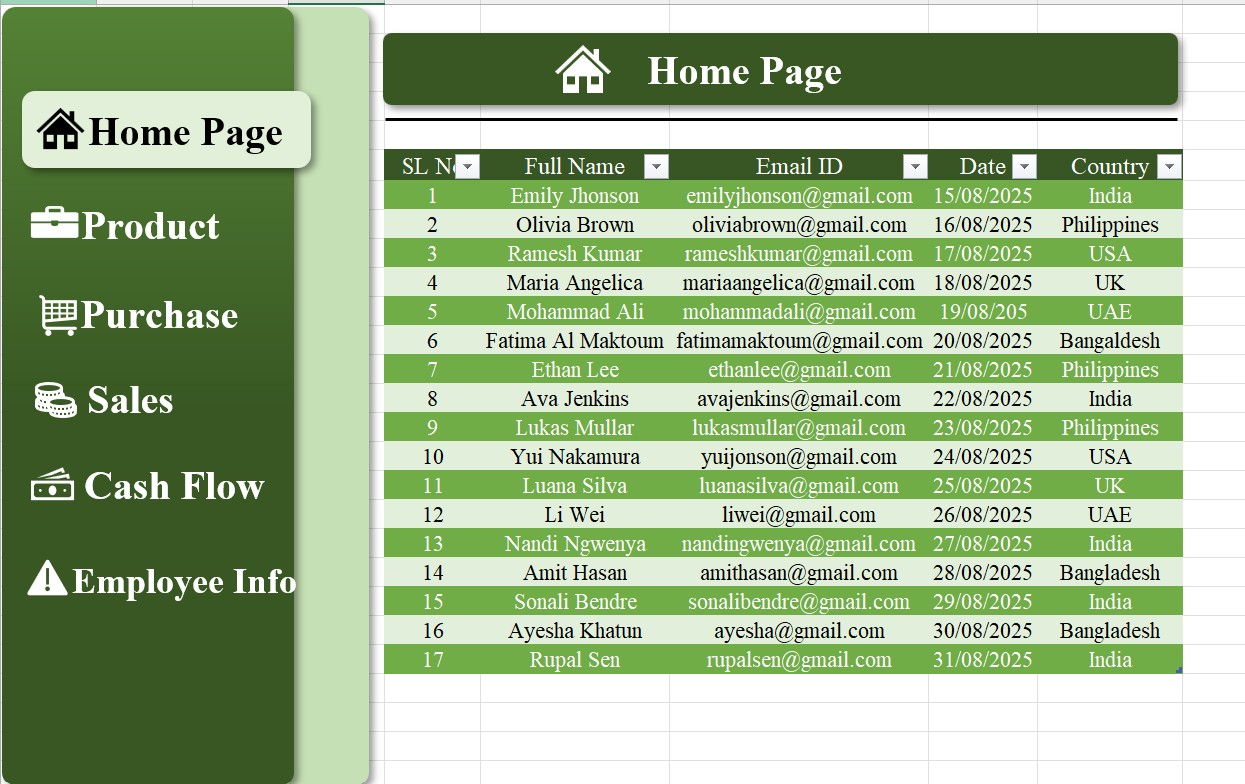
1/6 Automated Excel Navigation Bar
This Automated Excel Navigation Bar project was designed to create a user-friendly interface that allows seamless movement across multiple sheets and sections within a workbook. Built using Excel VBA and macros, the navigation bar includes clickable buttons, drop-down menus, and dynamic links for quick access to reports, dashboards, and data entry forms. It simplifies workflow, reduces manual searching, and enhances efficiency—perfect for businesses managing large or complex Excel files. Clean design, fast performance, and full automation make this navigation bar powerful addition for business
 1/3
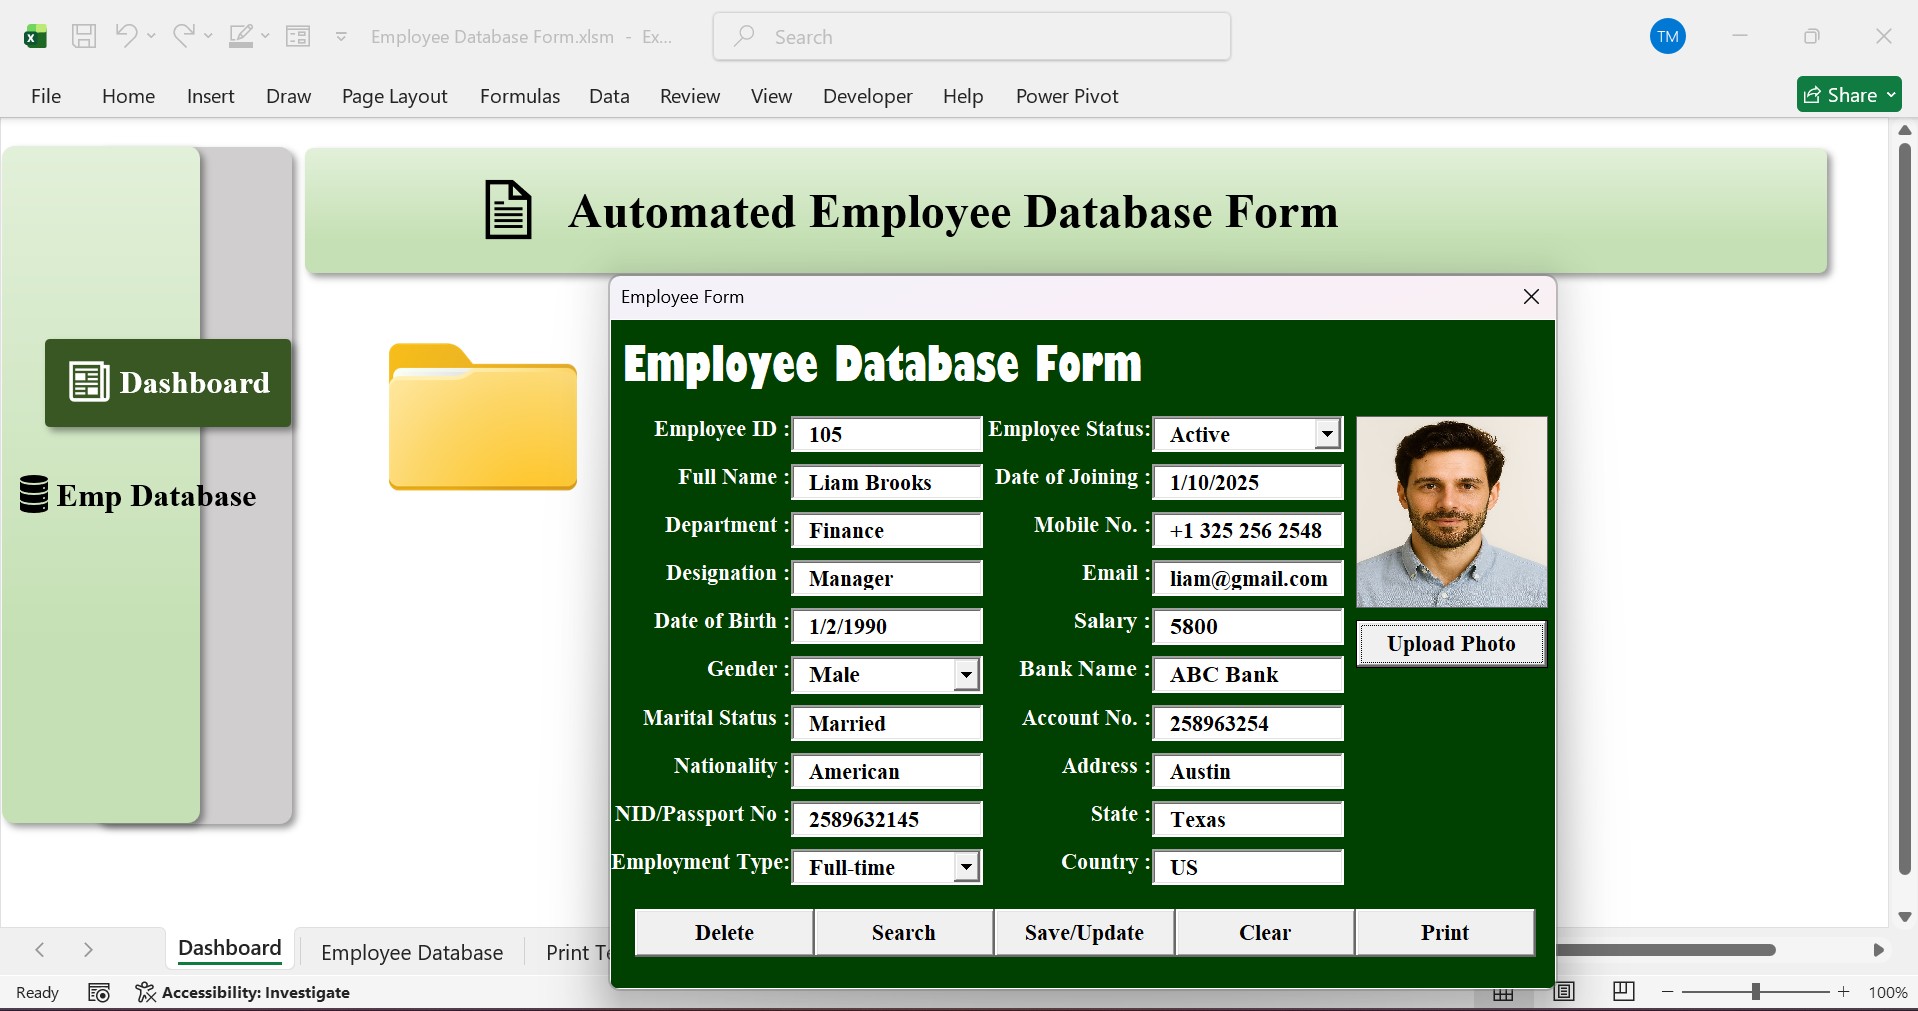
1/3 Employee Database Form in Excel
This project showcases a fully automated Employee Database Form developed using Excel VBA, Excel macro, and Excel automation to simplify employee record management. The system allows users to easily add, edit, delete, search and print employee data through a user-friendly VBA User Form with interactive buttons. It automates data entry, updates records instantly, and keeps information organized in a secure, structured format. This customized solution demonstrates how Excel automation can transform a simple spreadsheet into a powerful HR management tool for any business.
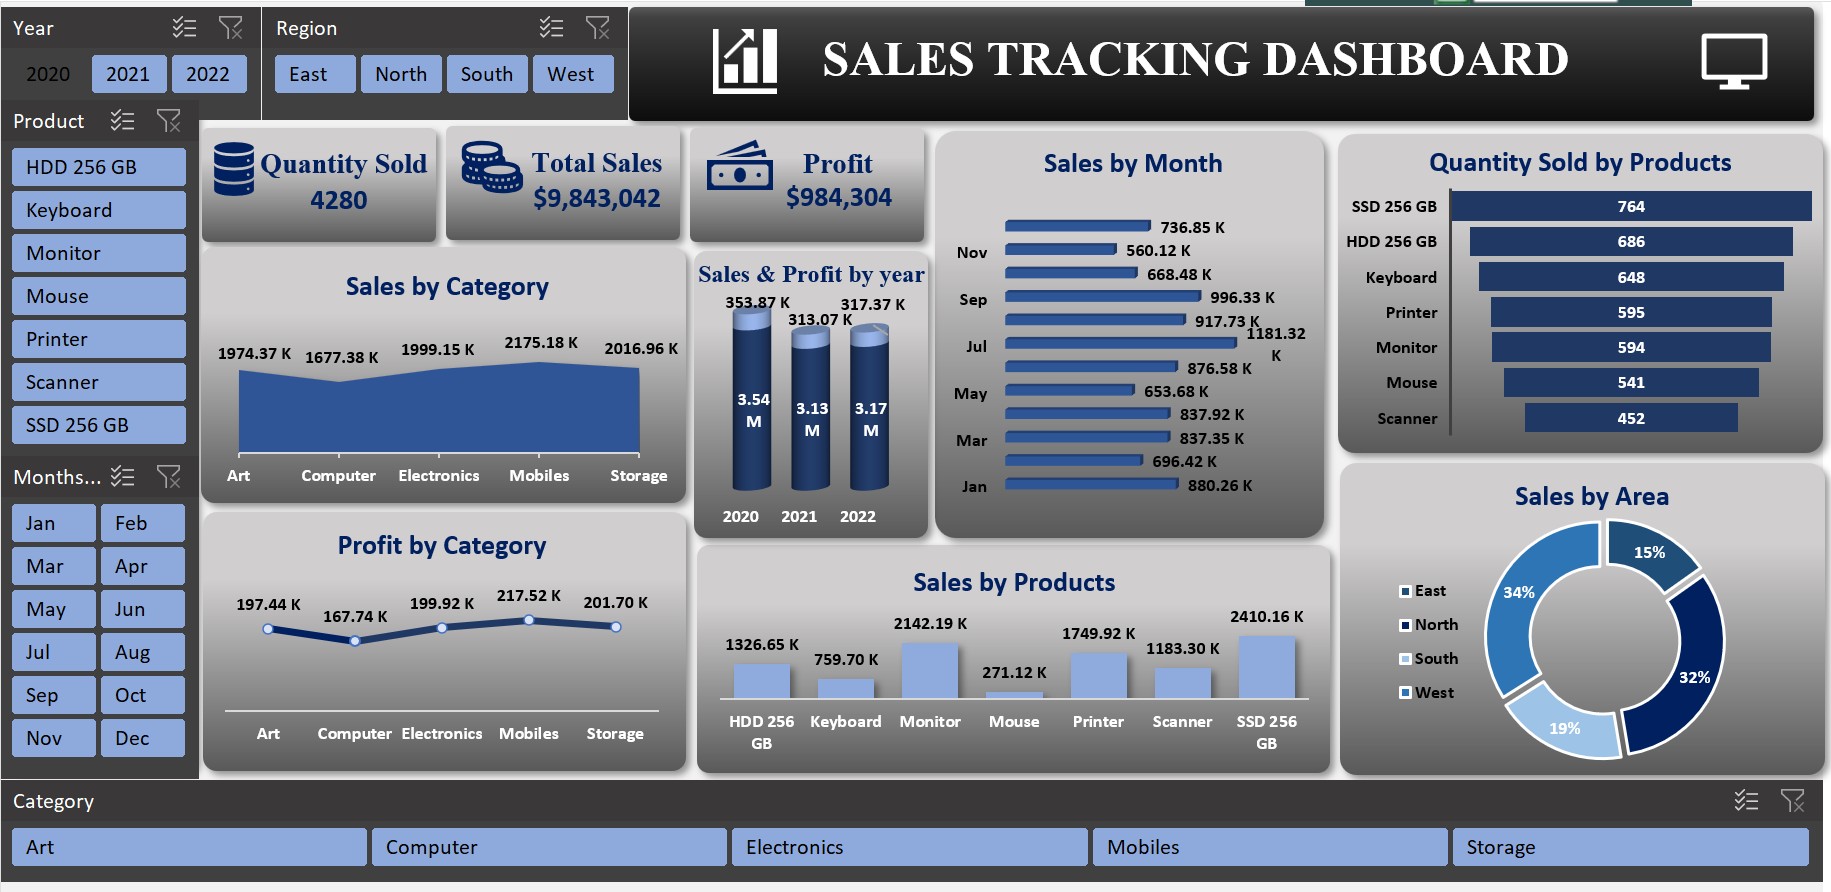
Sales Tracking Dashboard in Excel
The Sales Tracking Dashboard is designed to give a clear and organized view of overall sales performance. Built in Microsoft Excel, it helps track sales by region, product, and period, making it easy to monitor progress toward goals. The dashboard highlights key metrics like total revenue, target achievement, and top-selling products. With interactive charts, filters, and automated updates, it allows users to explore data in detail and make informed business decisions with ease.
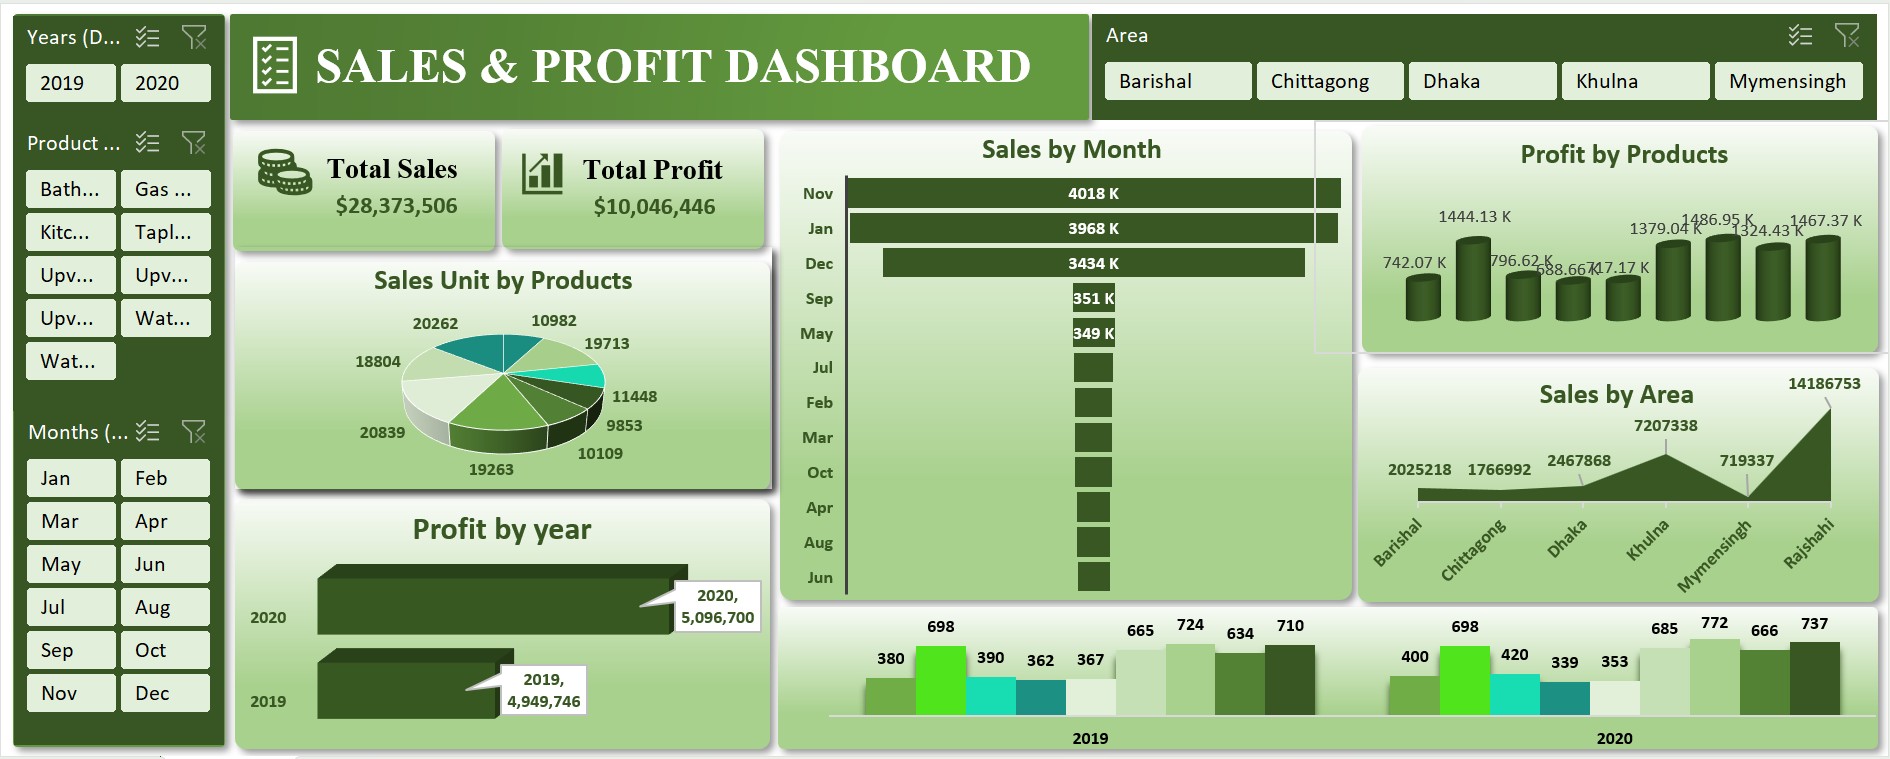
Sales & Profit Dashboard in Excel
The Sales and Profit Dashboard provides a clear and detailed view of business performance by combining sales and profit data in one place. Created in Microsoft Excel, it allows users to track revenue, profit margins, and product-wise performance across different regions and time periods. The dashboard highlights key insights such as top-performing products, high-margin areas, and trends over time. With interactive visuals and easy-to-use filters, it helps businesses identify growth opportunities, control costs, and make data-driven decisions efficiently.
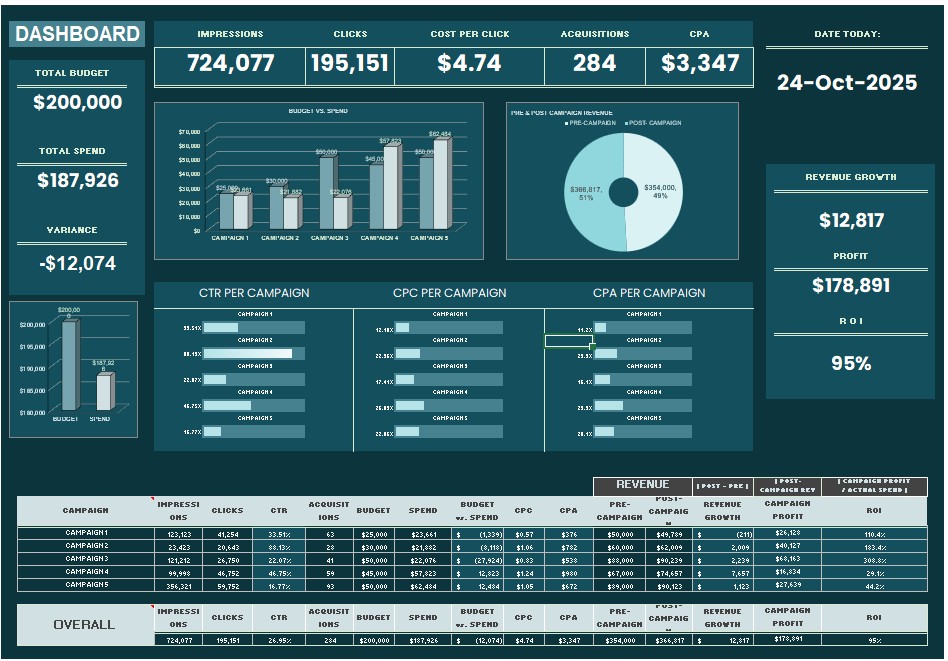
Revenue Dashboard in Excel
The Revenue Dashboard provides a clear and detailed overview of a company’s financial performance. Created in Microsoft Excel, it tracks revenue growth, profitability, and key financial trends across different periods and business segments. This dashboard helps identify top revenue sources, monitor targets, and analyze variations over time. With interactive charts, slicers, and automated summaries, it enables users to visualize financial data effectively and make confident, data-driven business decisions.
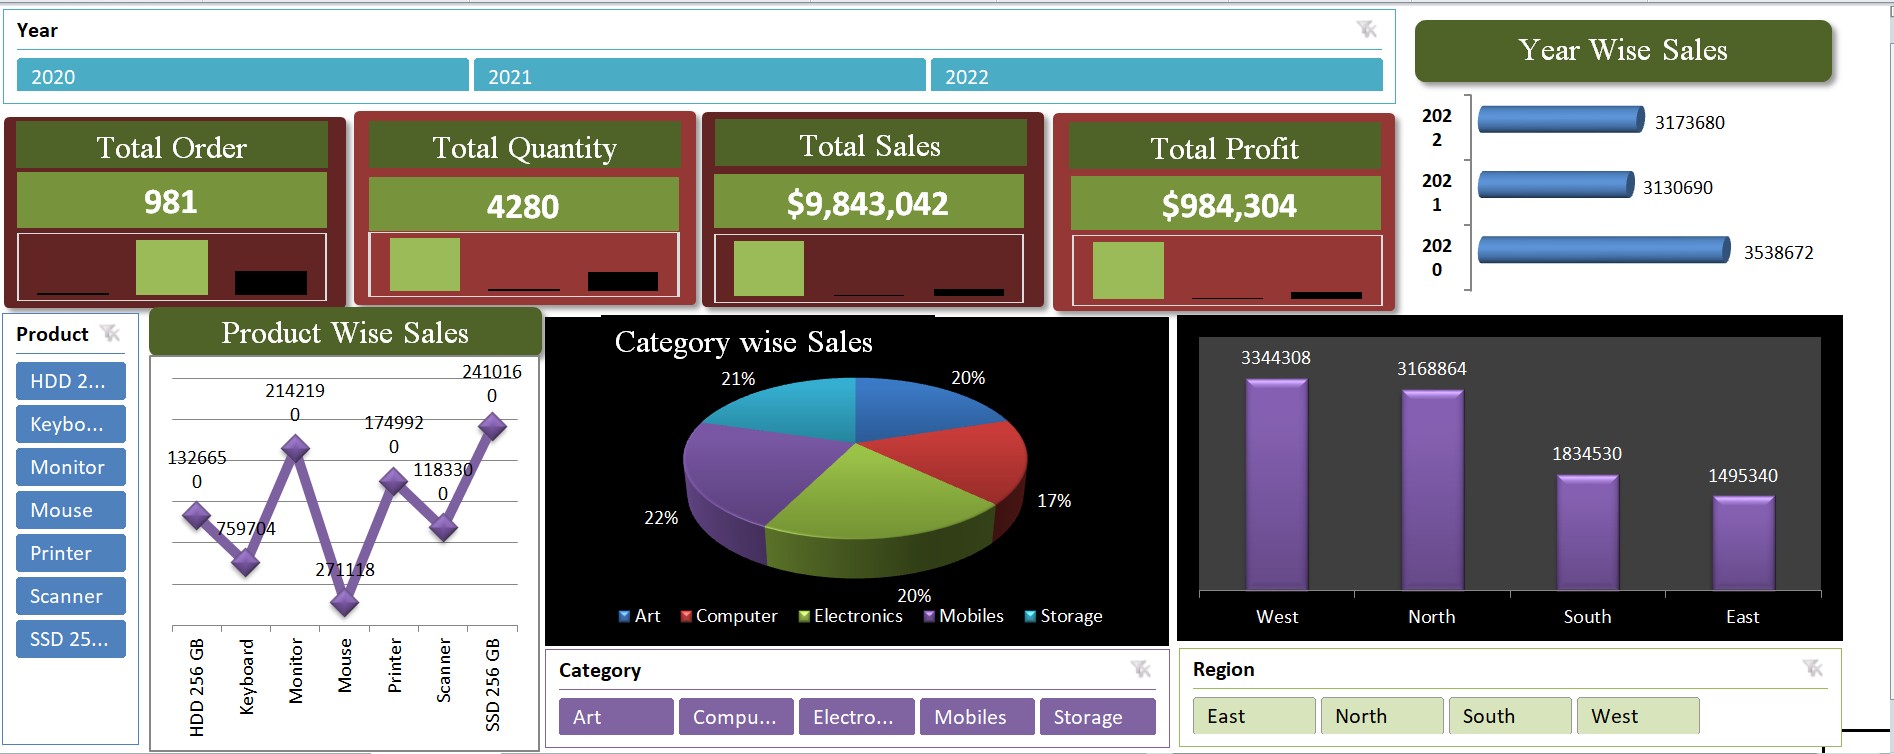
Simple Sales-Profit Tracking Excel Dashboard
The Simple Sales-Profit Tracking Dashboard provides an easy way to monitor sales and profit performance in one place. Built in Microsoft Excel, it allows users to track daily, weekly, or monthly results with clear visuals and summaries. The dashboard highlights key figures such as total sales, profit margins, and top-performing products. With clean charts and simple navigation, it helps businesses stay organized, understand their financial performance, and make smarter decisions quickly.
Loading reviews...